Server Management
In Server Management panel there are 4 tabs:
-
Overview
-
Database Management
-
Log
-
Configuration
Every information is referred to the server that you select at the top of the panel.
At the top there are some information about the selected server:
-
Status
-
JVM
-
OS architecture
-
OS name
-
Number of CPU
-
Java vendor
Overview
Overview shows a chart that represents CRUD operations for all databases divided by date and time and the number of executions for each operation.
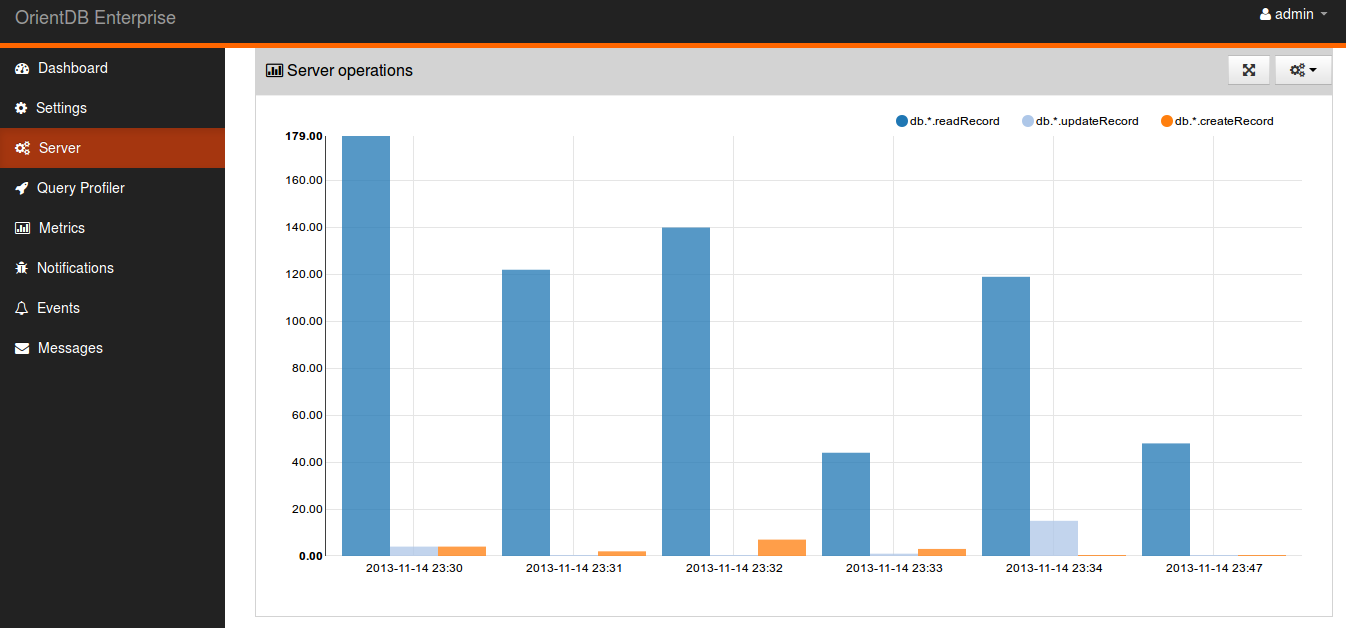
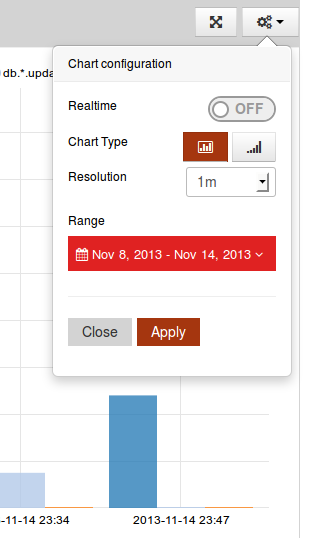
At the right top corner of the tab you can configure chart choosing the resolution (1m, 5m, 30m, 1h), the date range and the chart type.
|
|
You can even choose to see the graphics in real time (realtime option) selecting pull interval. |
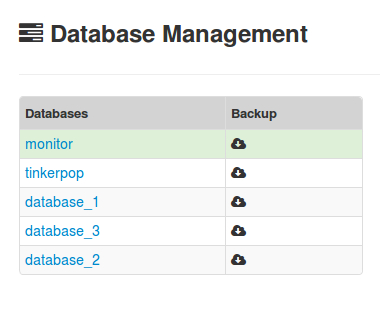
Database Management
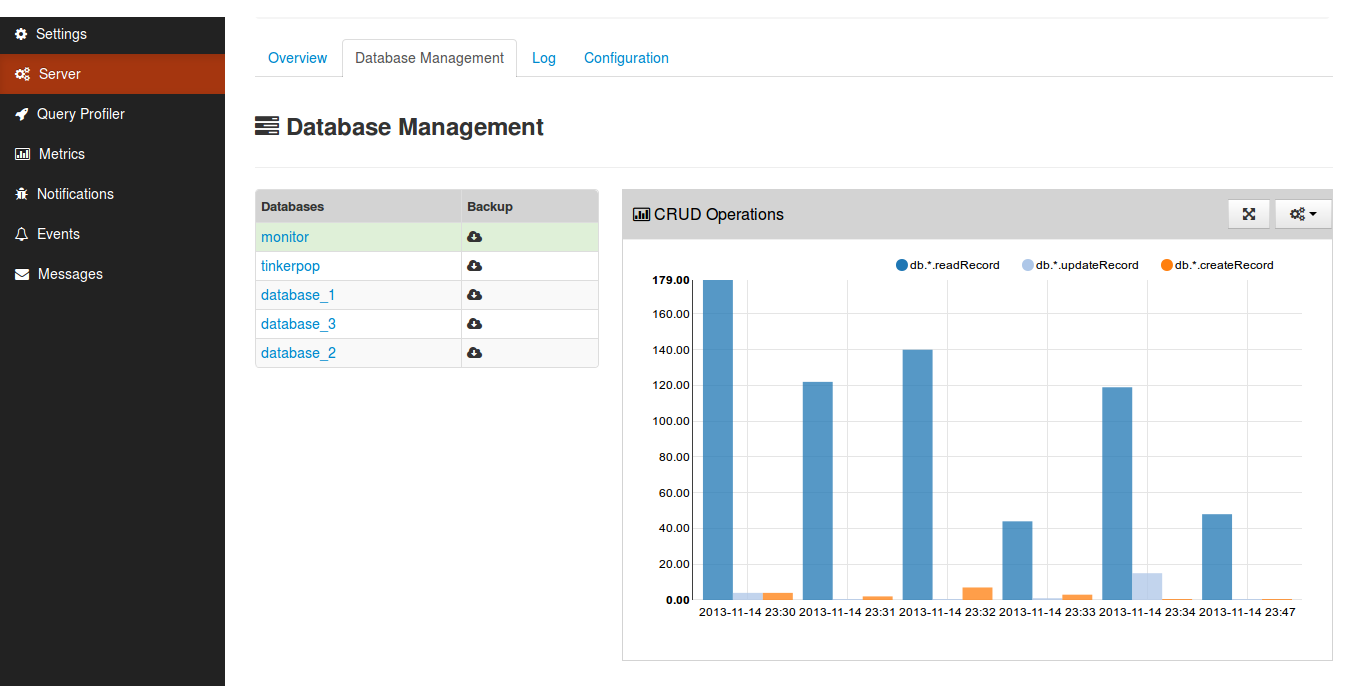
Database management panel shows the list of databases for each server and the chart of crud operations for the selected database.
|
|
select the database by clicking on the name. |
Database Backup
|
|
You can make a backup of each database, just click on the button on the right of the database name. |
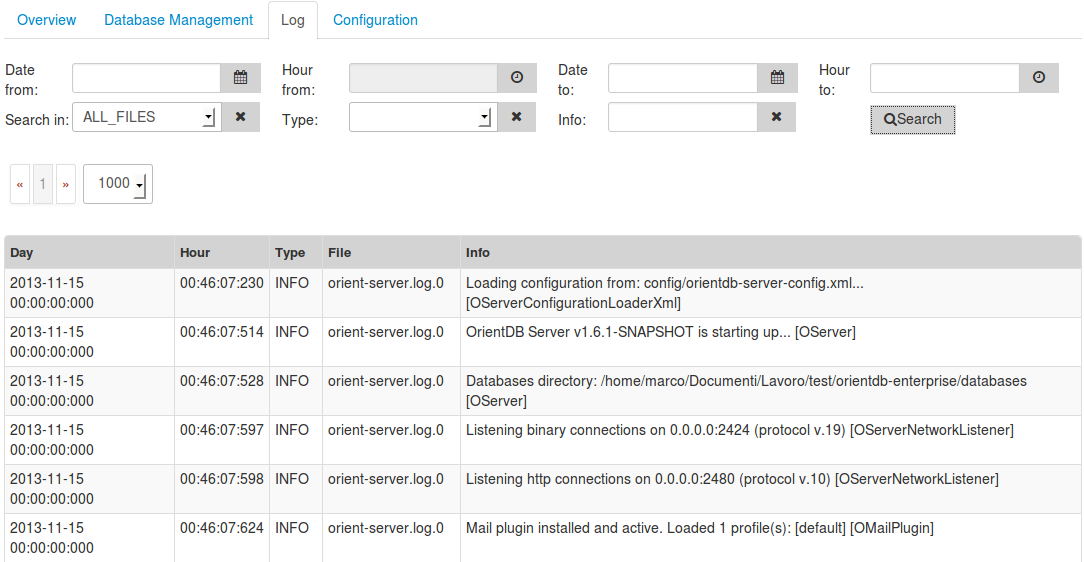
Log
Log panel shows all the logs for a particular server.
You can combine search according to the date and time, the log type, limiting the search to a single log file or to all files.
|
|
You can even search for a particular text just filling info input. |
|
|
Choose at least one file for your search. |
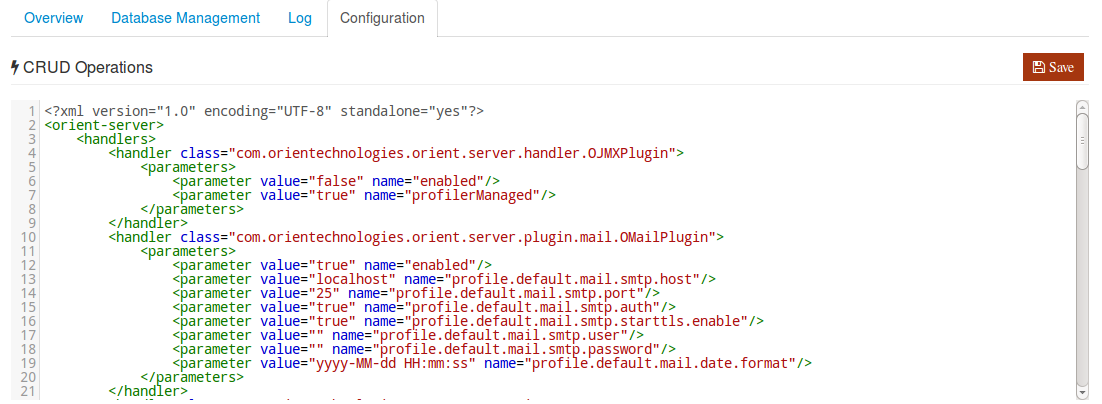
Configuration
In the last tab you can modify orientdb-server-config.xml. Click save to send the configuration back to the server.
|
|
Auto-reload isn’t supported until 2.0. |