1. Introduction
Based on the Community Edition, OrientDB provides additional Enterprise Class features like:
-
Workbench, as a centralized cockpit to manage multiple servers;
-
SQL Profiler, to tune the database based on usage patterns;
-
Metric Analyzer, to monitor and analyze metrics;
-
Configurable Alerts, to get notified when a node is unreacheable or when a metric breaks a configurable threashold;
-
Query Profiler;
-
Notification about hot-fixes and new releases;
-
Production support available on demand;
2. Getting Started
|
|
For configuring server please follow this guide |
3. Server Management
In Server Management panel there are 4 tabs:
-
Overview
-
Database Management
-
Log
-
Configuration
Every information is referred to the server that you select at the top of the panel.
At the top there are some information about the selected server:
-
Status
-
JVM
-
OS architecture
-
OS name
-
Number of CPU
-
Java vendor
3.1. Overview
Overview shows a chart that represents CRUD operations for all databases divided by date and time and the number of executions for each operation.
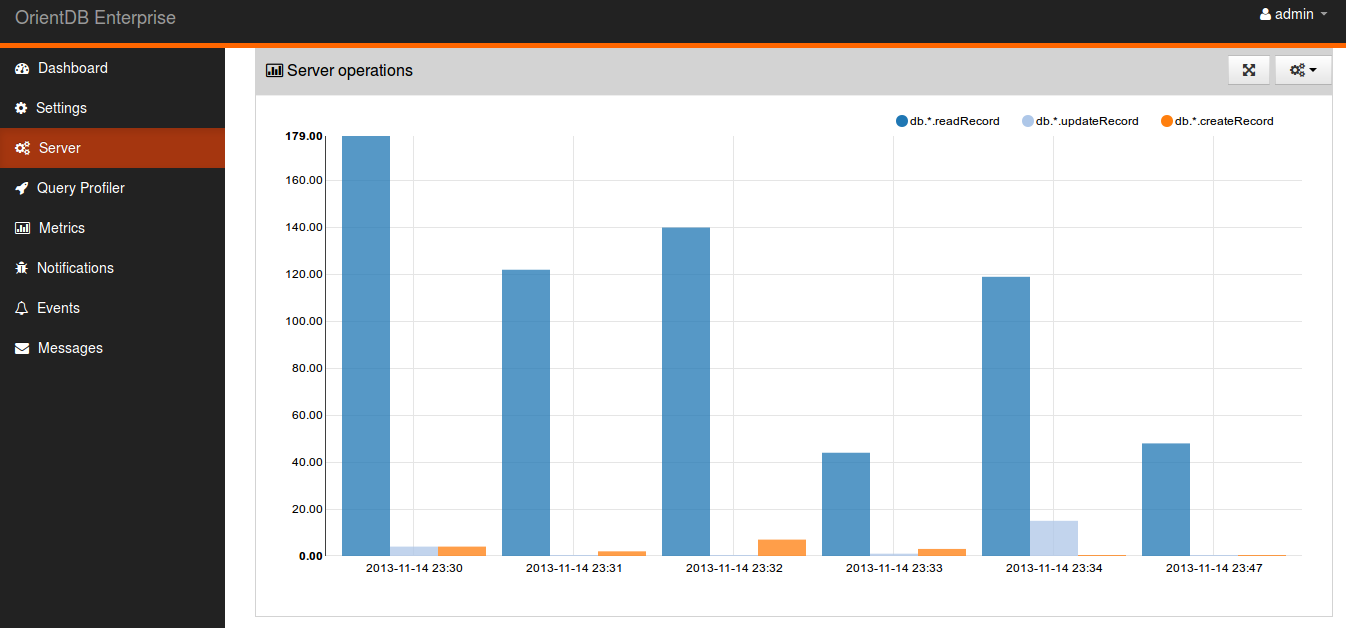
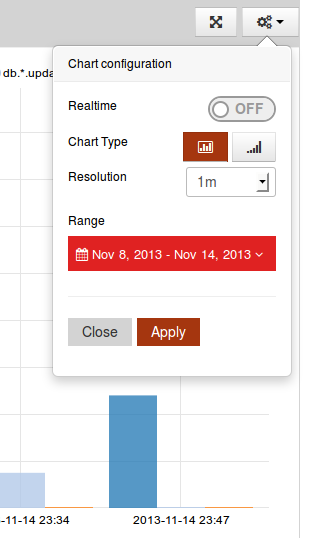
At the right top corner of the tab you can configure chart choosing the resolution (1m, 5m, 30m, 1h), the date range and the chart type.
|
|
You can even choose to see the graphics in real time (realtime option) selecting pull interval. |
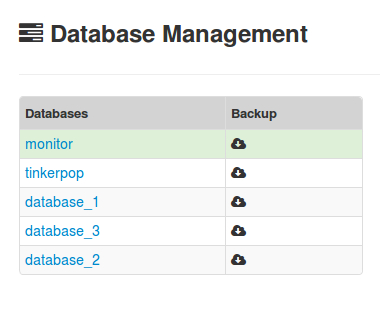
3.2. Database Management
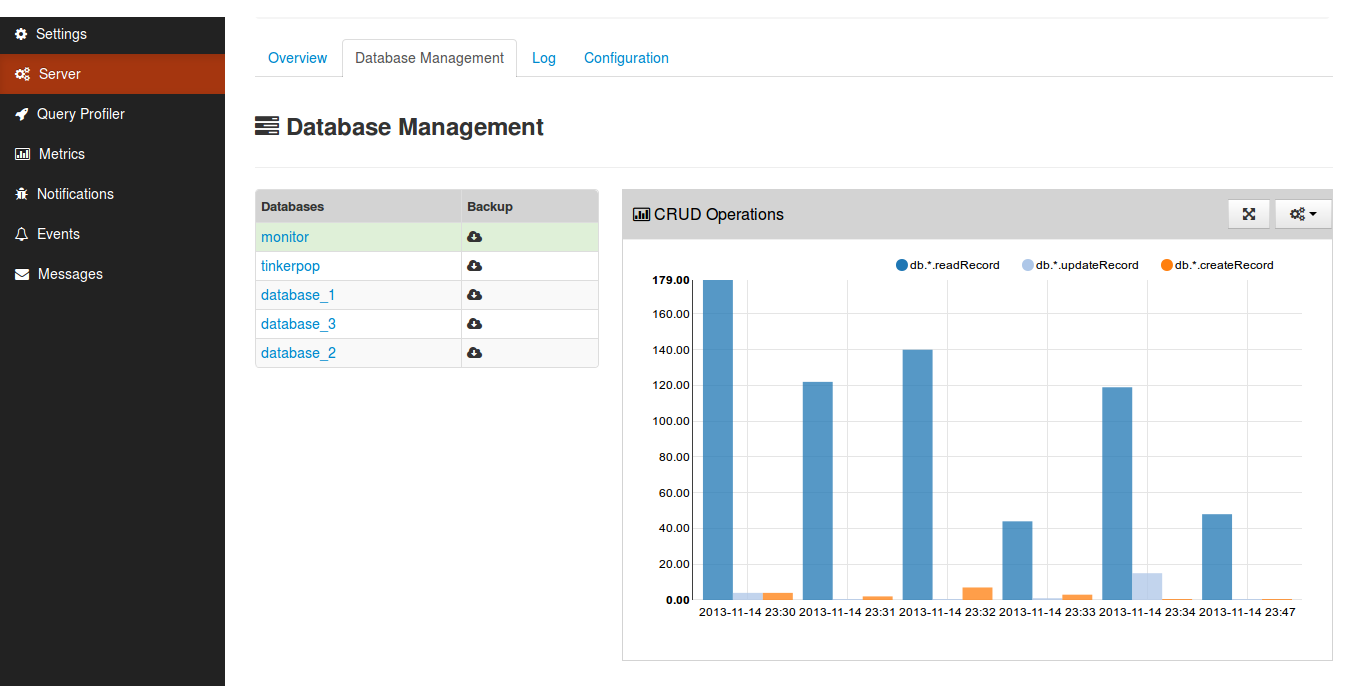
Database management panel shows the list of databases for each server and the chart of crud operations for the selected database.
|
|
select the database by clicking on the name. |
3.2.1. Database Backup
|
|
You can make a backup of each database, just click on the button on the right of the database name. |
3.3. Log
Log panel shows all the logs for a particular server.
You can combine search according to the date and time, the log type, limiting the search to a single log file or to all files.
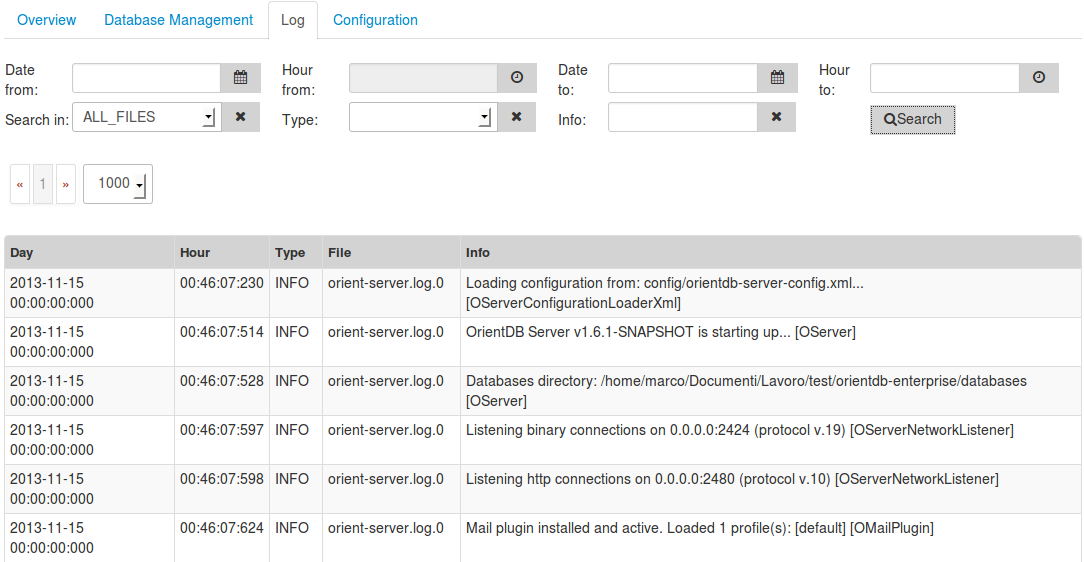
|
|
You can even search for a particular text just filling info input. |
|
|
Choose at least one file for your search. |
3.4. Configuration
In the last tab you can modify orientdb-server-config.xml. Click save to send the configuration back to the server.
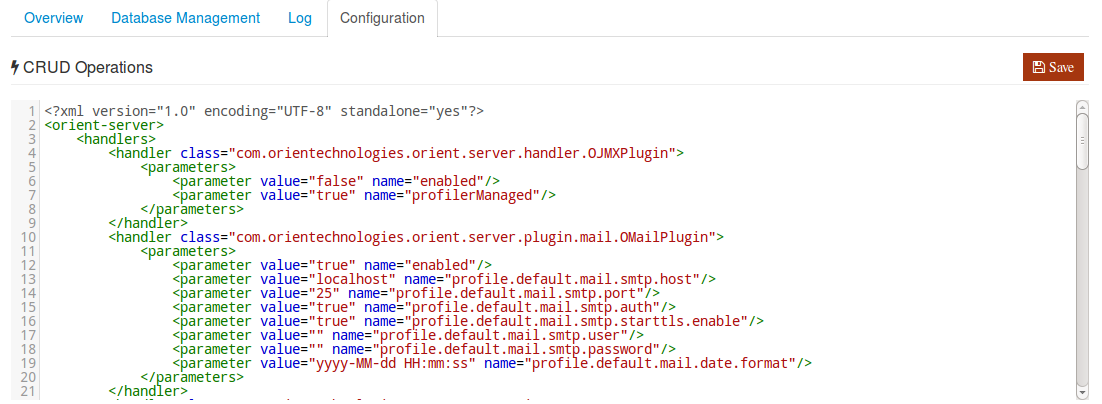
|
|
Auto-reload isn’t supported until 2.0. |
4. Metrics
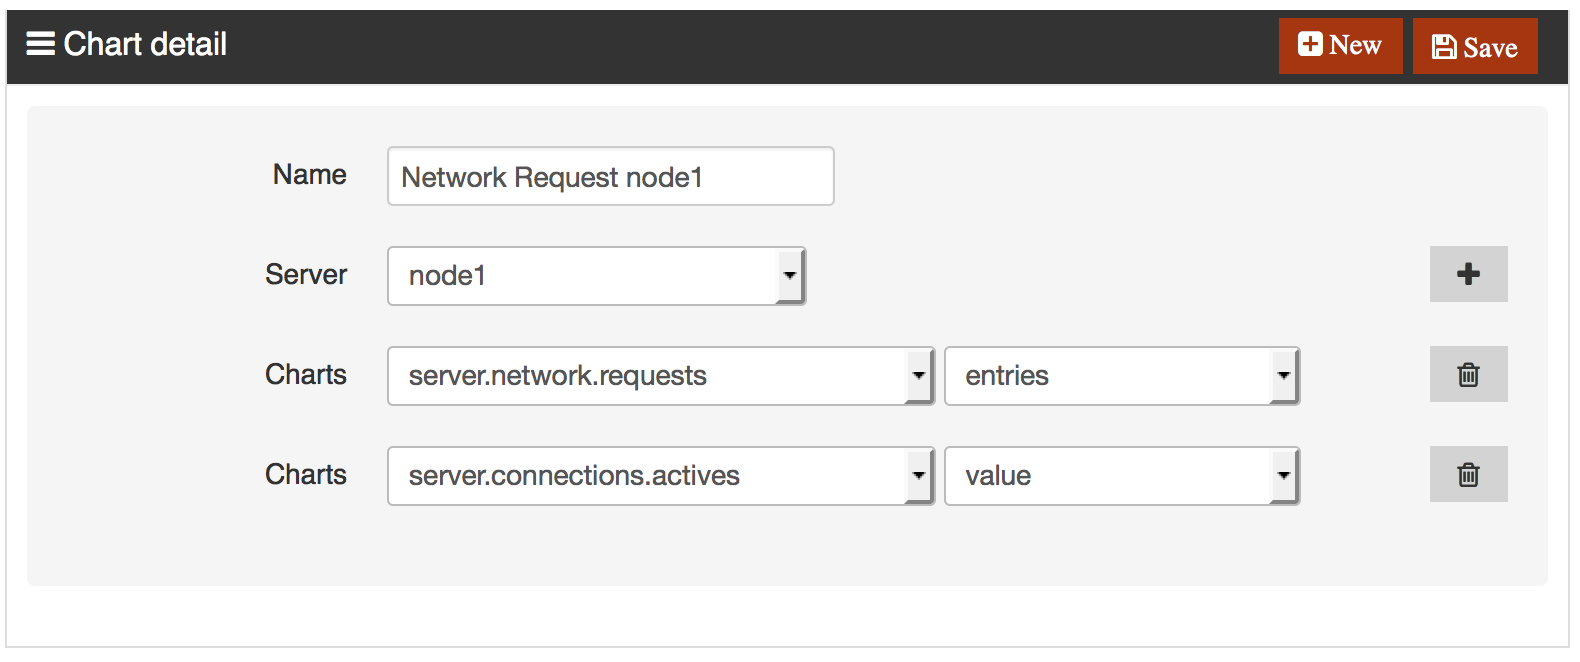
Metrics panel helps you to configure the metrics of interest by choosing from a list of these.
A list of saved configuration are displayed on the left.
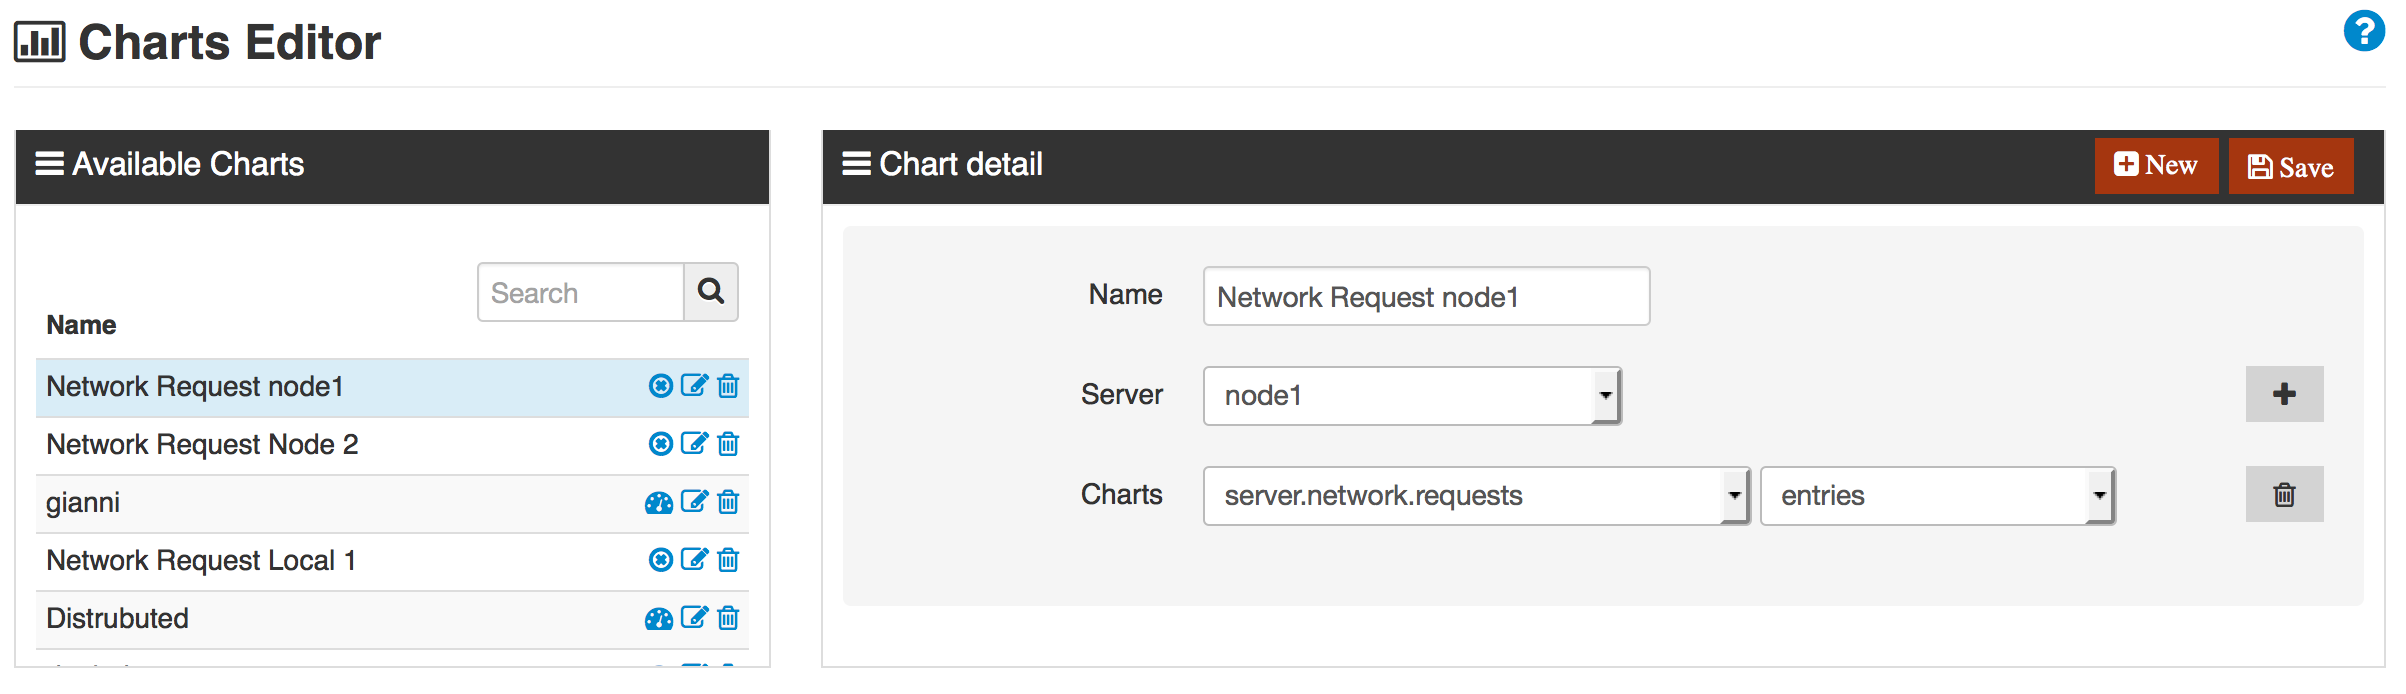
If you want to build a new configuration:
-
click on "new" button
-
write a name
-
select a server
-
click on plus button to add a metric
-
choose a metric and a value
|
|
if you want you can combine more metrics in one configuration |
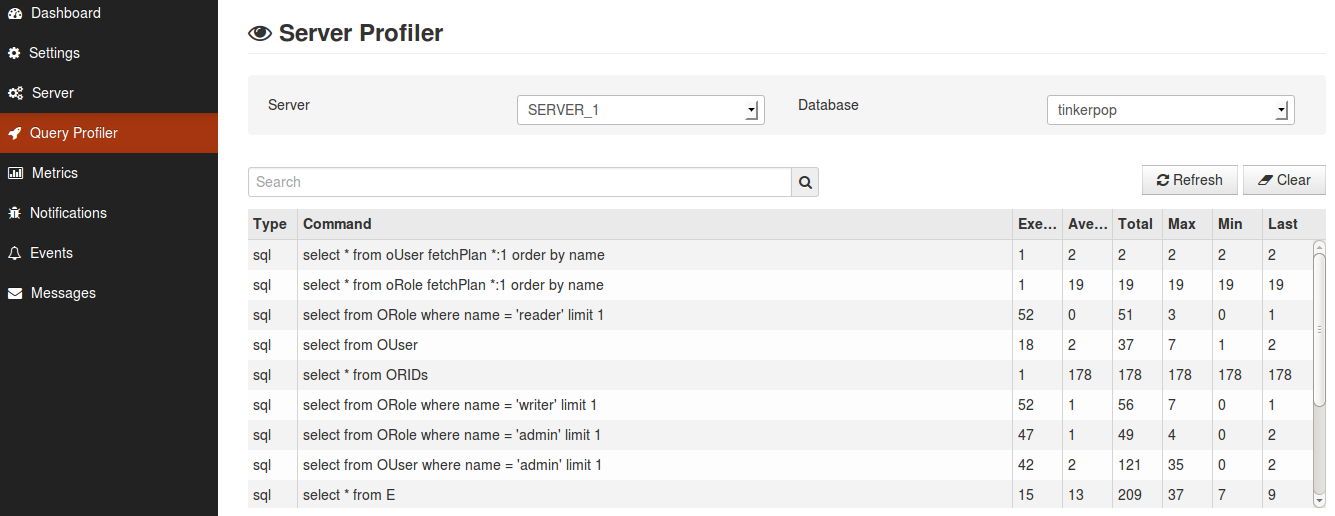
5. Query Profiler
Query profiler panel shows the commands executed for a database on a particular server.
It also shows the type of command, the minimum and maximum number of times executed and the media.
Click "clear" to delete them.
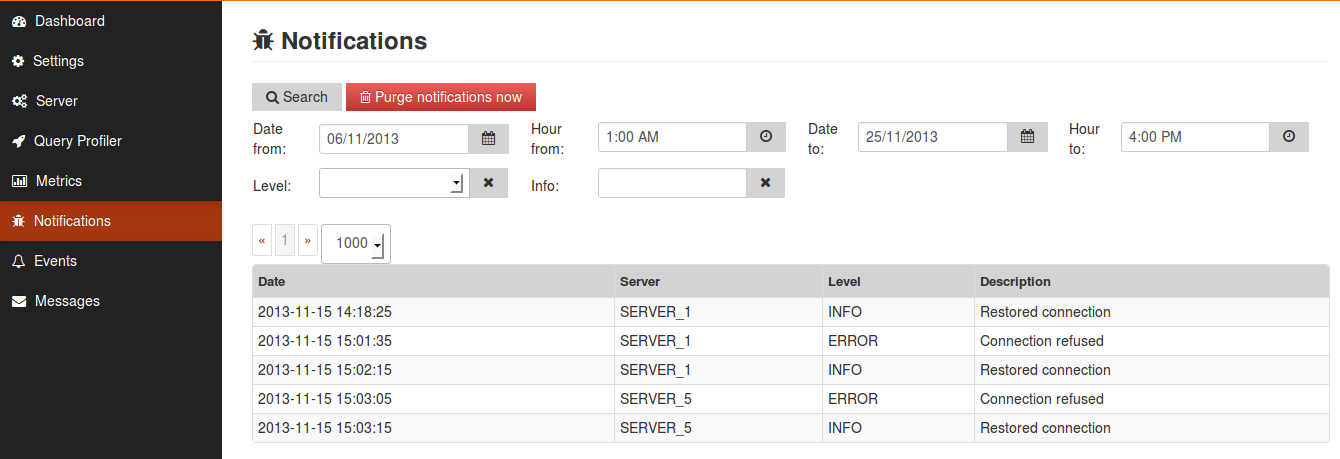
6. Notifications
Notifications panel is similar to Log panel.
In this case you can search all notifications in Workbench databases just combining the search according to the date and time and the log type.
|
|
To free up disk space, you can delete all the logs from the database by clicking the button "Purge notifications now". |
7. Alerts
You can configure alerts based on certain events that may occur over time (server down, metrics that exceed critical values).
Particularly when a metric or a log meets a certain condition can trigger the sending of an email, the execution of an HTTP request or the execution of a function
When:
-
Log
-
Metric
Do:
-
Send Mail
-
Execute HTTP
-
Execute Function
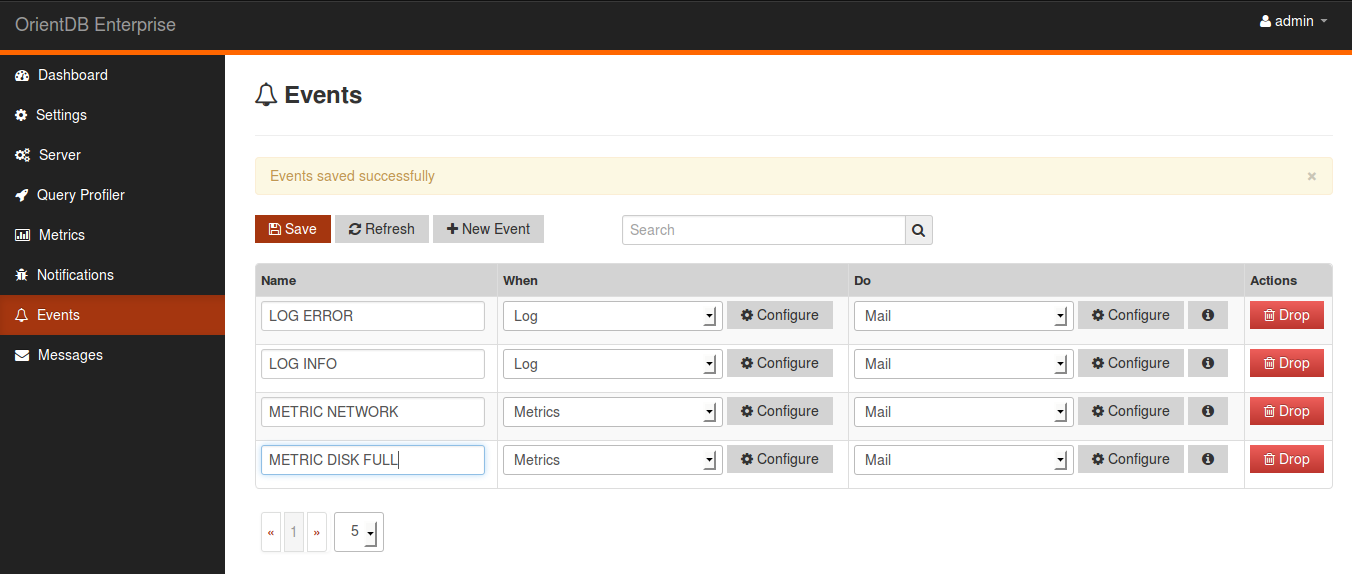
Let’s take an example to better understand how events work:
If I would like to receive an email when an error happens on my server I can:
-
click on "new event button";
-
select "Log" on column "when";
-
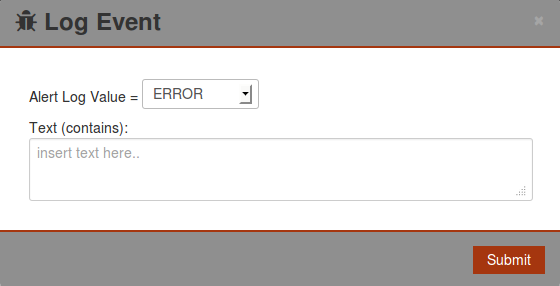
click "configure" button (on column "when") and enter the necessary data as shown in figure "Log alert";
-
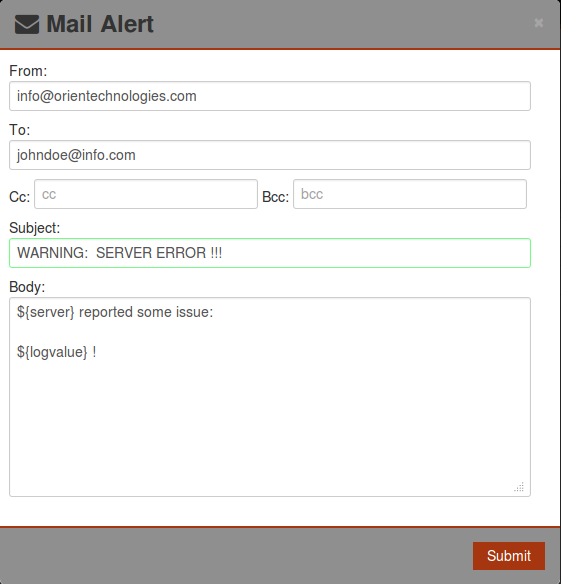
now select "Mail" on "Do" column and click "configure" and enter the necessary data as shown in figure "Mail alert";
-
click on save button
|
|
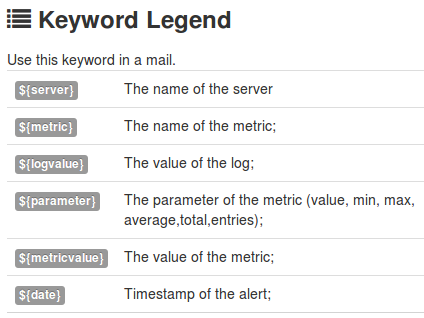
There are some keywords that you can use for a better notification. Workbench will replace it with the right data. |
|
|
from address, to address, subject and body are mandatory in mail alert. |
|
|
for smtp configure please see Setting chapter. |
8. Settings
In this panel you can configure some settings for the entire Workbench. There are four tabs:
-
Dashboard Configuration
-
Metrics Configuration
-
Mail Settings
-
Global Settings
8.1. Dashboard Configuration
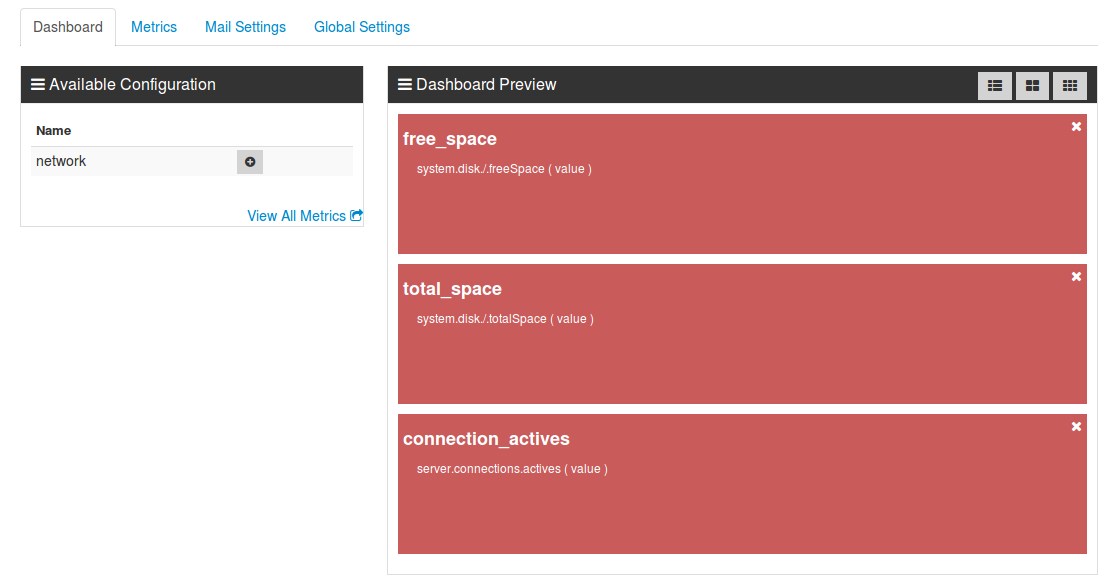
At the left of the panel you have a list of all metrics chart that you have configured in the Metrics panel.
Here you can choose a set of it and the layout to componing the Workbench home page (list or a grid).
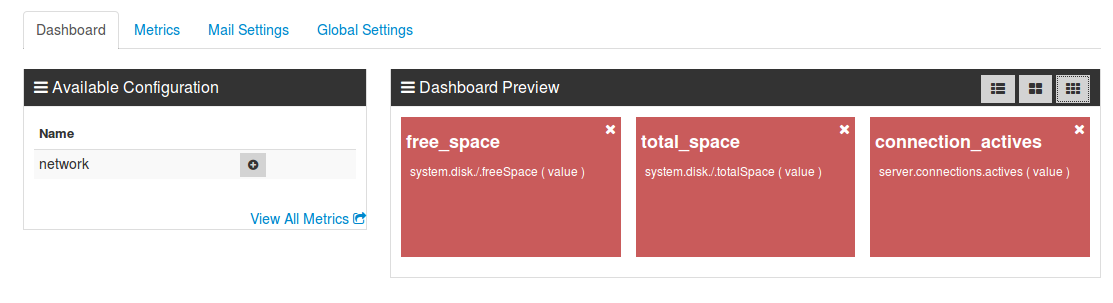
|
|
remember to click on the Save button to make the changes permanent |
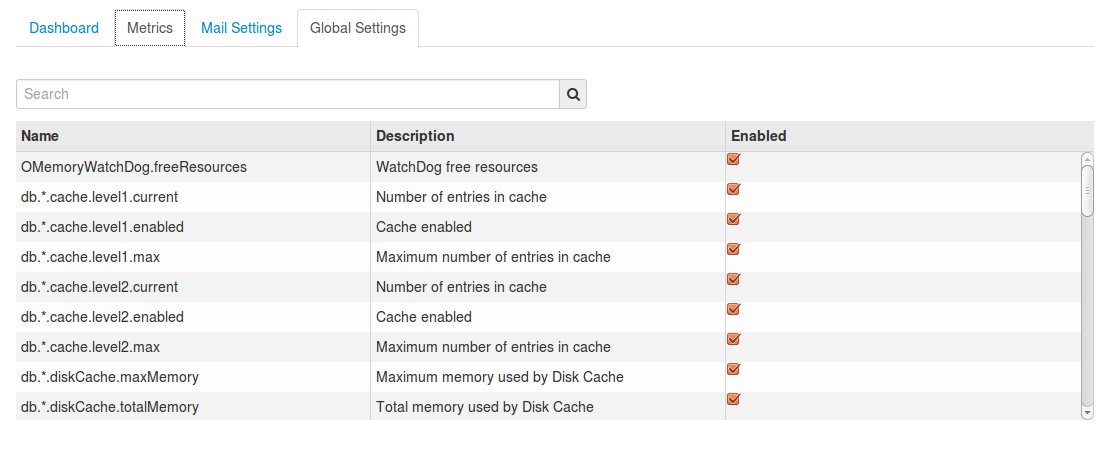
8.2. Metrics Configuration
In metrics configuration you choose wich metrics the Workbench will save in datatabase; check it to
enable/disable a metric.
8.3. Mail Settings
In mail settings panel you can configure your server smtp that will be used in events task.
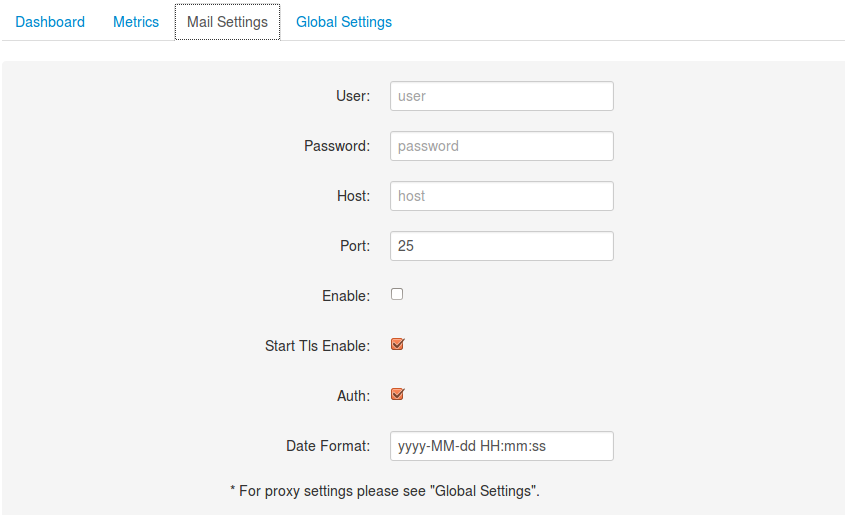
|
|
for proxy settings see Global Settings. |
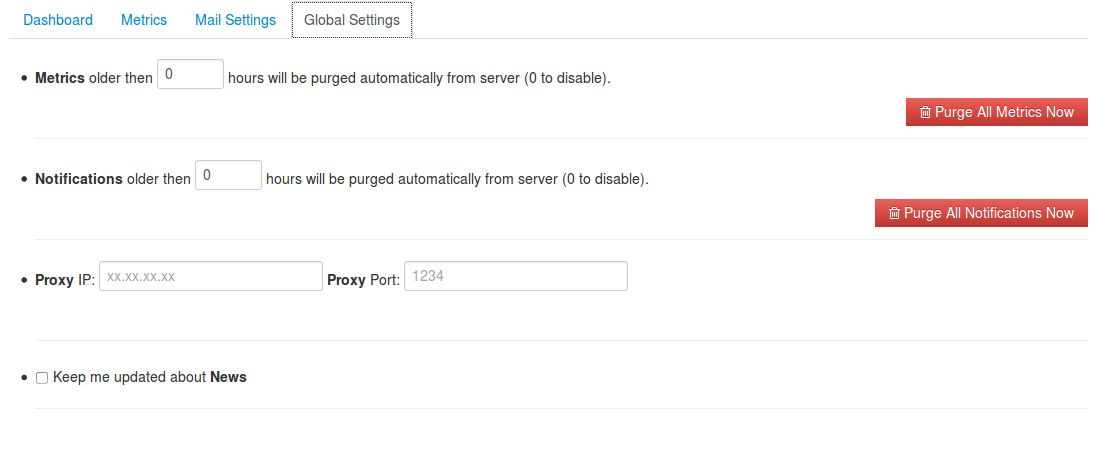
8.4. Global Settings
In this panel you can:
-
free up disk space, a schedule will purge metrics and logs older than x hour;
-
purge all metric and notifications in Workbench database. Click on the button "purge all metrics now" and "purge all notifications now";
-
Set a proxy to permit http request in events panel.
-
Keep update about news of orientDB.
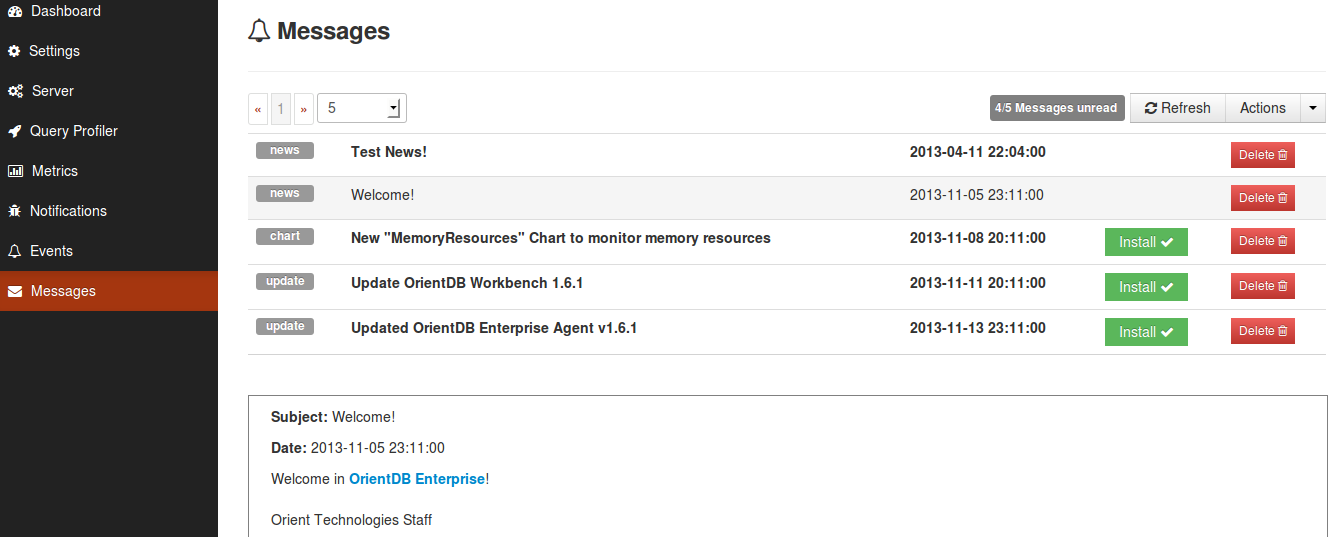
9. Messages
Messages panel shows all notification from Orient Technlogies.
There are three types of messages:
-
Commercial news about orientDB.
-
Chart configuration.
-
Workbench or Agent updates, hot fixes.
|
|
Just click on the message to open it. |
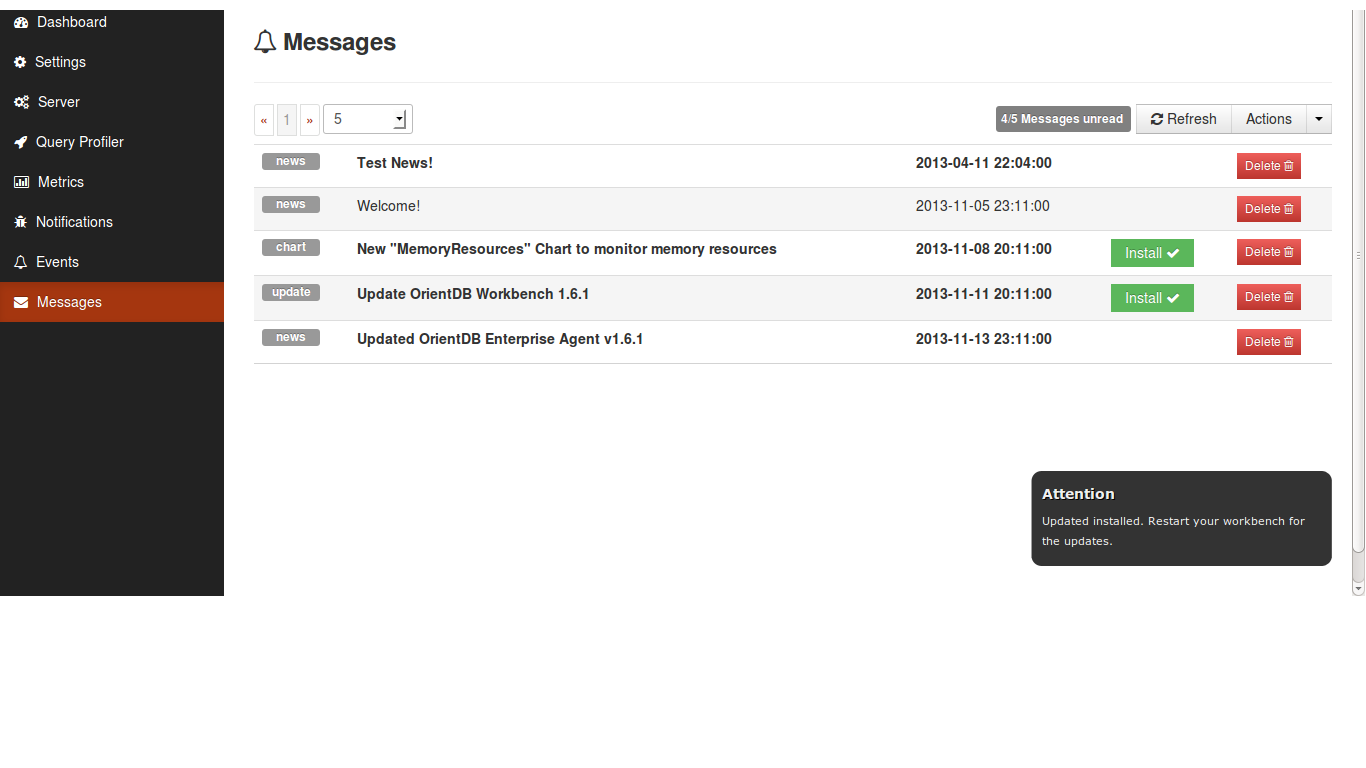
To install an upgrade version just click on the "install" button.
A pop-up will confirm the installation and instructions to make it effective as shown in the figure below.
|
|
You can mark all messages as read or you can delete them. |