Server Profiler
Only users with grant
server.metricscan see this section
This sections contains information about Queries:
- Real Time queries
- Statistics about queries
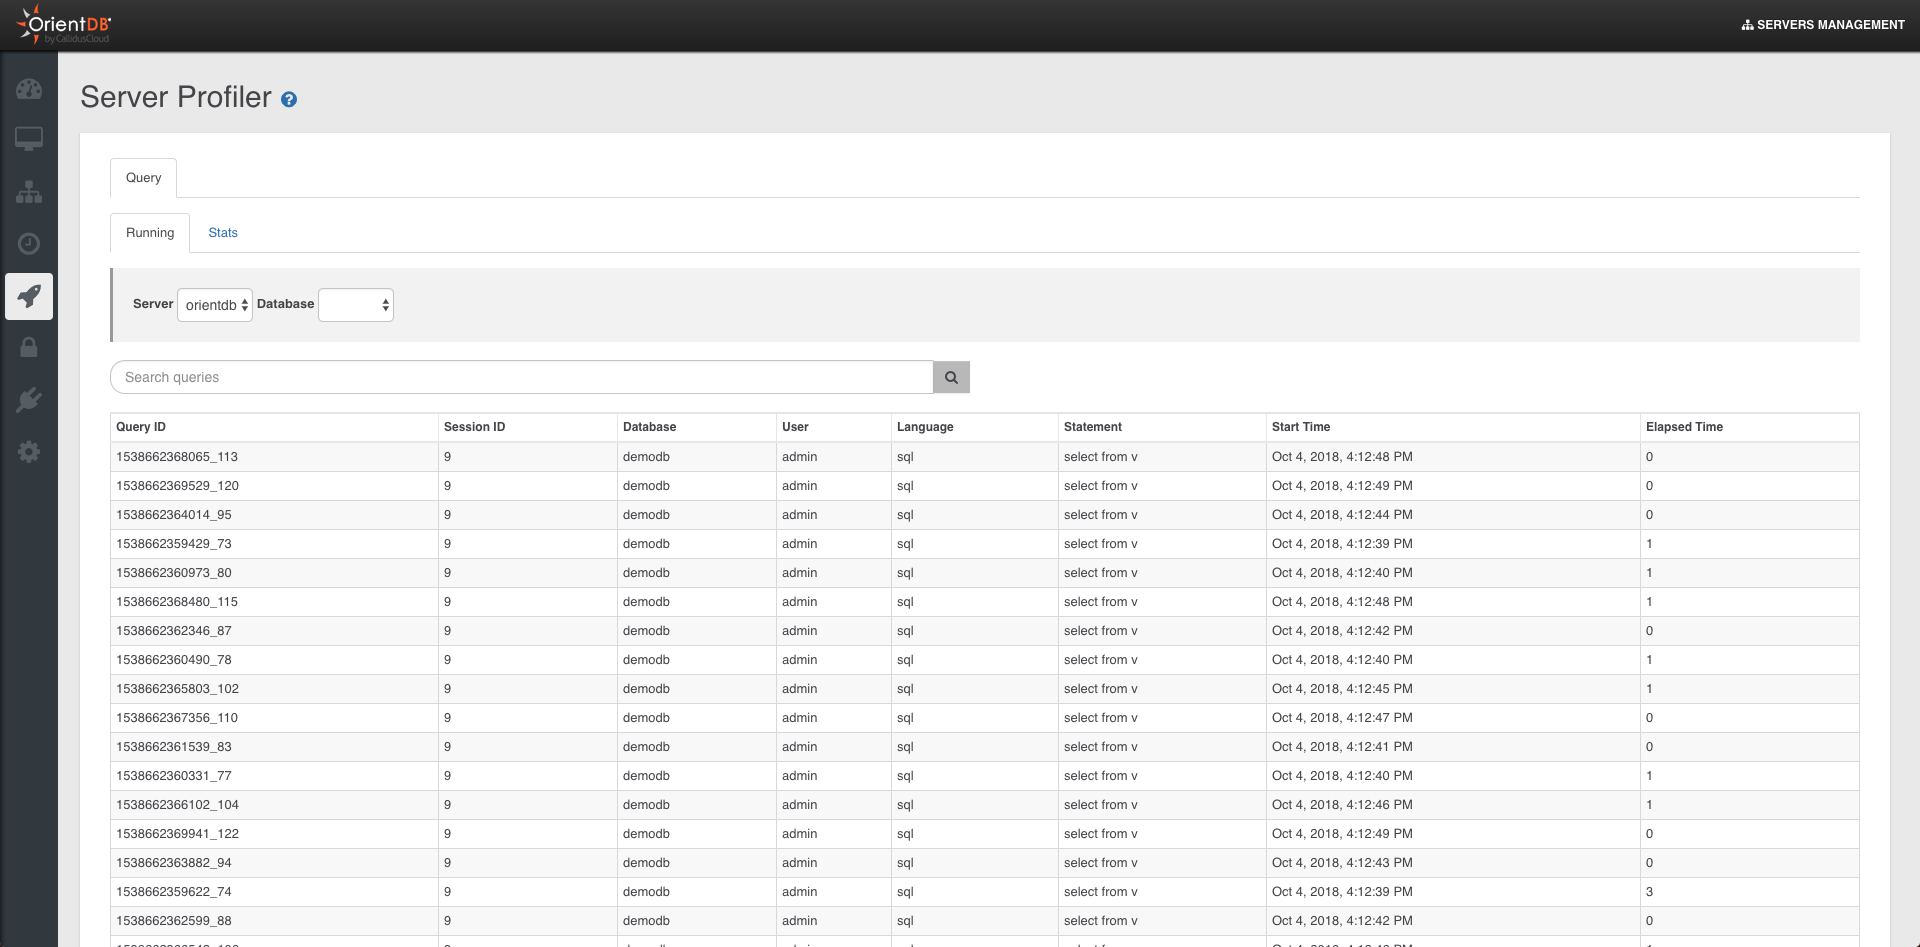
Running Queries
Displays information about running queries in OrientDB Server. Each query report the following infos:
Query ID, as the unique query numberSession ID, the session id used for the queryDatabase, the database usedUser, the database userLanguage, The language used. SQL or GremlinStatement, the actual text of the queryStart Time, when the query was startedElapsed Time, the actual timing of the query in milliseconds
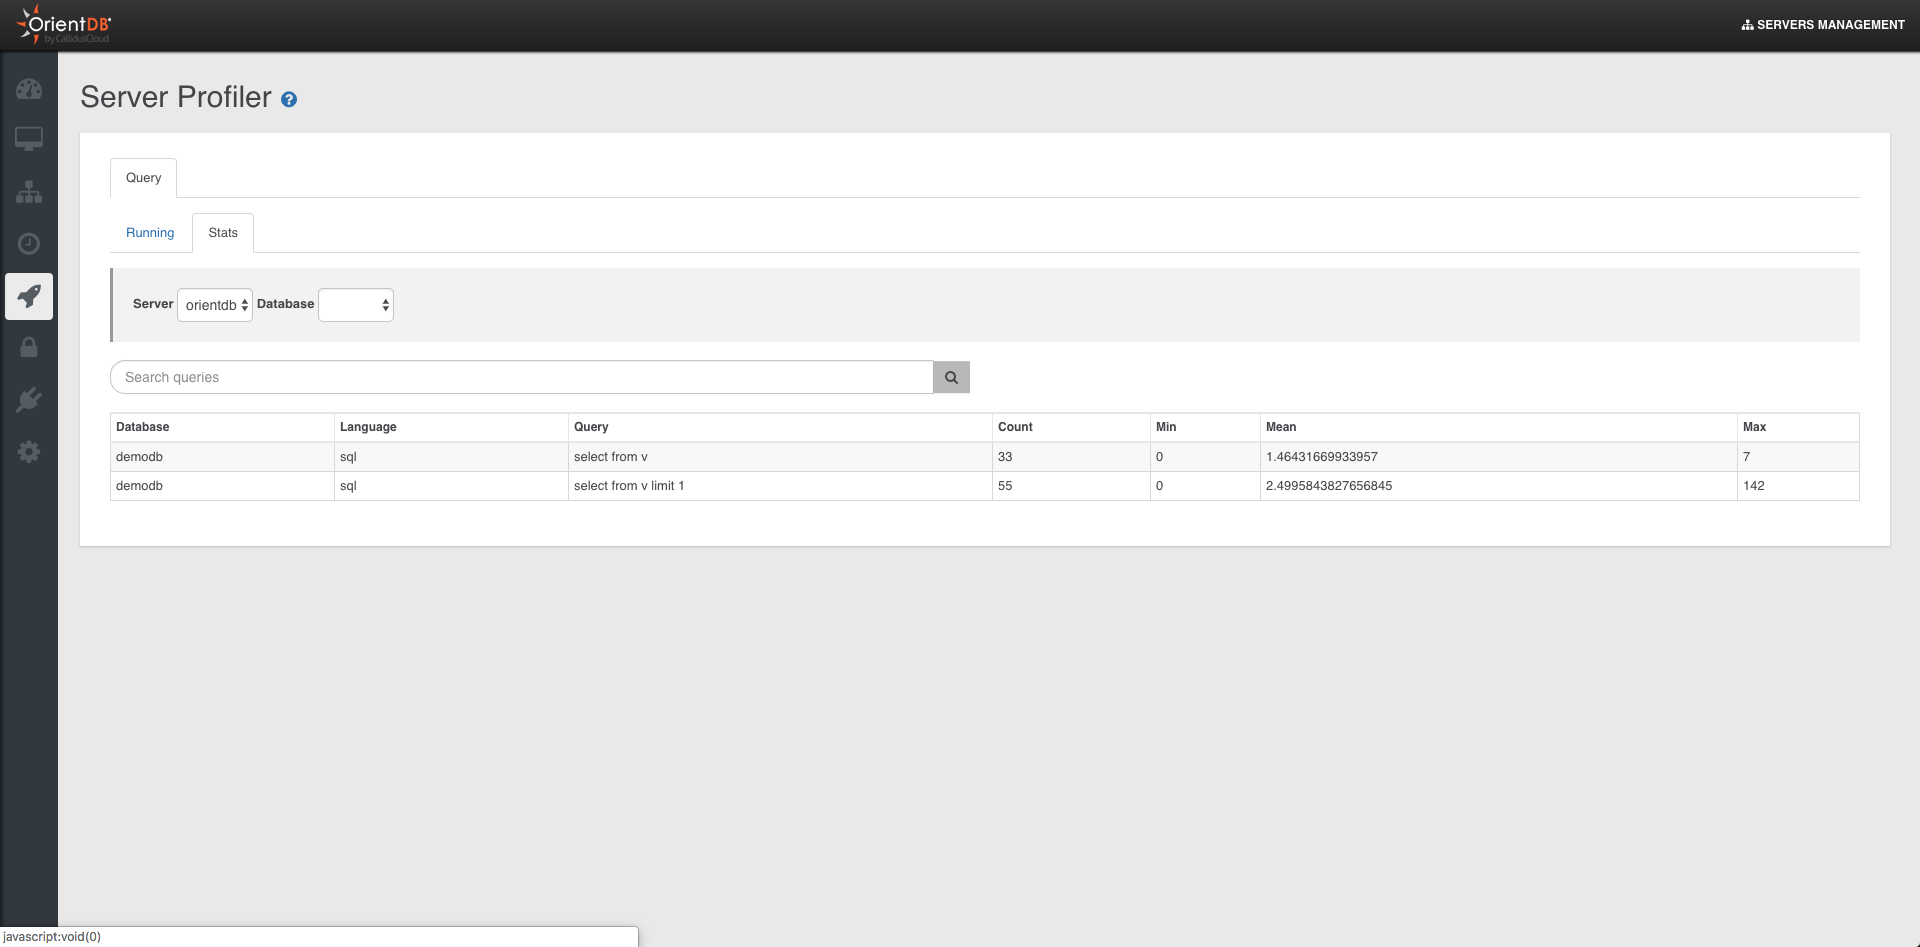
Queries stats
Displays statistics about executed queries in OrientDB Server. Each query report the following infos:
Database, the database usedLanguage, The language used. SQL or GremlinQuery, the actual text of the queryCount, how many times the query was executedMin, the minimum execution time of the queryMean, the mean execution time of the queryMax, the maximum execution time of the query
HTTP APIs
Retrieve running queries via HTTP
GET | Basic Auth
http://<server>[<:port>]/sqlProfiler/running?server=<name>
where
<name> : should be the name of the node in case of distributed version of orientdb.