Dashboard Panel
Starting from version 2.2, Studio Enterprise Edition includes a new easy-to-read and single-page Dashboard with constantly updated reports. The Dashboard shows a graphical presentation of the current status and historical trends of each node joining your cluster. Performance indicators are reported in order to enable instantaneous and informed decisions which you can make at a glance.
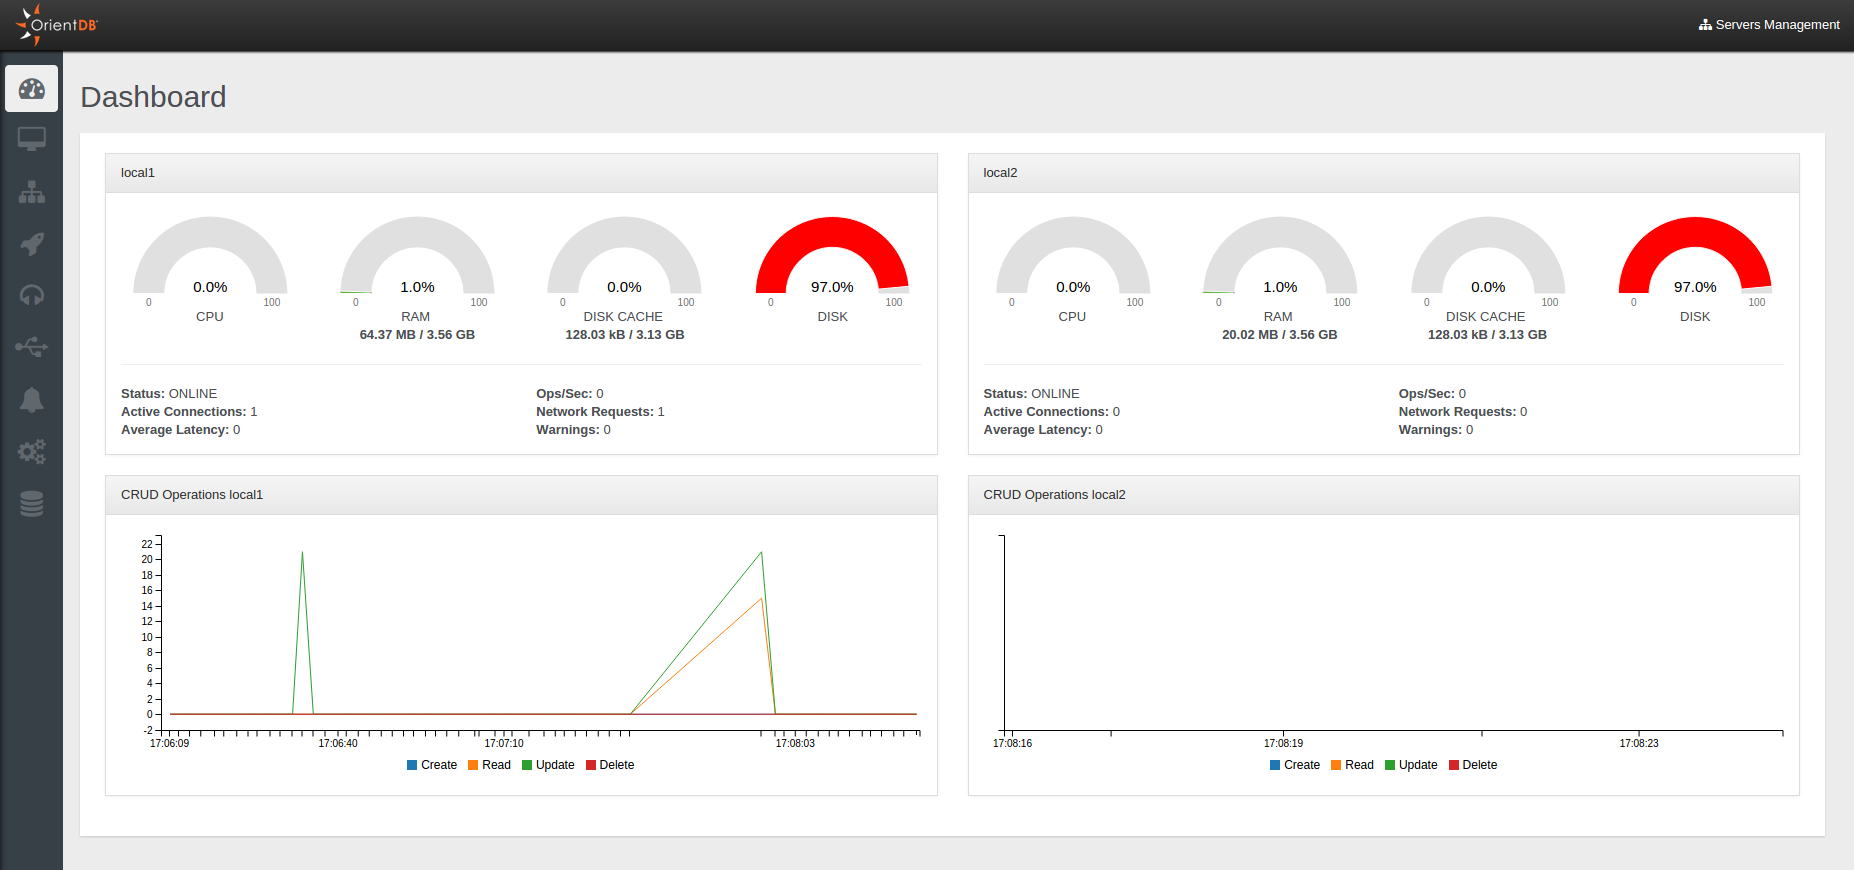
Here you can see the Dashboard reporting the status of a cluster composed of two nodes.
For each node you can monitor several information divided in two main sections:
System report
CPU,RAM,DISK CACHEandDISKusedStatusof the nodeOperations per secondActive ConnectionsNetwork RequestAverage LatencyWarnings
CRUD operations: includes a
Live Chartof CRUD operations in real time.